Newcomb's Measurements of the Speed of Light
Simon Newcomb made a series of measurements of the speed of light between July and September 1882. He measured the time in seconds that a light signal took to pass from his laboratory on the Potomac River to a mirror at the base of the Washington Monument and back, a total distance of 7400m. His first measurement was 0.000024828 seconds, or 24,828 nanoseconds (109 nanoseconds = 1 second). The data are the deviations (differences) from 24,800 nanoseconds.
Euro Coins
The data were collected by Herman Callaert at Hasselt University in Belgium. The euro coins were "borrowed" at a local bank. Two assistants, Sofie Bogaerts and Saskia Litiere weighted the coins one by one, in laboratory conditions on a weighing scale of the type Sartorius BP 310s.
Singers in the New York Choral Society
Each singer in the NY Choral Society in 1979 self-reported his or her height to the nearest inch. Their voice parts in order from highest pitch to lowest pitch are Soprano, Alto, Tenor, Bass. The first two are typically sung by female voices and the last two by male voices.
Cat's Eyes
Eyes of species with highly developed eyes such as cats and man don't have their ganglion (eye-sight) cells evenly distributed over the surface of the retina but have a much greater concentation towards the center. In the early stages of fetal development, though, the distribution is much more uniform. This conforms with predictions made by the theory of evolution. In the data set we have the area of the retina and the ratio of the number of cells in the center to the periphery.
Fly's Eyes
Data from an article in genetics on flies' eyes. Stocks of Drosophila melangonaster Meig were hatched in nine incubators whose temperature veried from 15C to 31C in steps of 2C. The response is the number of facets in the eys of each hatched fly (on a log scale)
NGC 7531
NGC 7531 is a spiral galaxy in the southern hemisphere. When looked at from earth, the galaxy fills a very small area of the sky. If the only motion of the galaxy relative to earth were to move away from us due to the big bang, then over the entire region the velocity relative to earth would be constant and equal to about 1600 km/h. But the actual motion is complex. The galaxy appears to be spinning and there are other motions which are not well understood. The velocity at different point seems to vary by as much as 350 km/s.
Cats
Fisher (1947) published a dataset of H.G.O. Holck giving the heart weights, body weights and sex of 47 femal and 97 male adult cats.
Scottish Hill Races
The record times in 1984 for 35 Scottish hill races.
The components are:
dist: distance in miles (on the map)
climb: total height gained during the route, in feet.
time: record time in minutes.
Source: A.C. Atkinson (1986) Comment: Aspects of diagnostic regression analysis. Statistical Science 1, 397�402.
Brain and Body Weights in Mammals
The data give average brain weight and average body weight for 62 different species of land mammals. Data:
body: The average body weight for the species (in kilogrammes).
brain: The average brain weight for the species (in grammes).
SOURCE: Weisberg, S. (1985) Applied Linear Regression (Second edition). John Wiley.
Medieval Churches
Gould (1973) has speculated on the applicability of biological "laws" of shape to other objects. To study this, he chose a "simple minded" example: medieval churches. These were built in a very wide range of sizes and shapes, to serve fairly similar purposes. Because of limitations due to the use of stone as a building material, we might speculate that the relationship between various measurements of the churches will be very strong. The data lists the perimeter in hundreds of meters and area in hundreds of square meters for 25 post-Conquest Romanesque churches in Britain. The data were measured from ground plans given by Clapharn (1934) and kindly provided by S. J. Gould.
Highway Accidents
This data set, taken from an unpublished Masters thesis by Carl Hoffstedt and discussed in Weisberg, S. (1985) Applied Linear Regression, relates the automobile accident rate, in accidents per million vehicle miles, to 13 potential predictors. The data include 39 sections of large highways in the state of Minnesota in 1973. The variables are
rate: accidents per million vehicle miles
len: length of the segment in miles
adt: average daily traffic count in thousands
trks: truck volume as a percent of total traffic
slim: speed limit
lwid: lane width in feet
shld: with in feed of outer shoulder
itg: number of freeway-type interchanges per mile
sigs: number of signalized interchanges per mile
acpt: number of access points per mile
lane: total number of traffic lanes in both directions
fai: 1 if federal aid interstate highway, 0 otherwise
pa: 1 if principal arterial highway, 0 otherwise
ma: 1 if major arterial highway, 0 otherwise.
Old Faithful guyser
The Old Faithful Geyser in Yellowstone National Park erupts every 35 to 120 minutes. The duration of each eruption lasts for 1� to 5 minutes. Notice that Old Faithful is not as faithful as one might expect. The time between eruptions and the length of each eruption varies quite a bit. However, one can estimate the time of the next eruption quite accurately given the duration of the previous eruption.
The data set we will work with consists of the duration of eruption and time between eruptions for 272 different eruptions of Old Faithful taken over a number of days in August 1978 and August 1979. (From Applied Linear Regression, 2nd Edition, by Sanford Weisberg, pp. 231 and 234.) The times given are in minutes. We will use the length of the duration to predict the length of the amount of time until the next eruption again. The park rangers at Yellowstone do this and their predictions are posted near the geyser and at the web cam picture site located http://www.nps.gov/yell/oldfaithfulcam.htm
Fish Storage
A study was conducted to examine the quality of fish after several days in ice storage. Ten raw fish of the same kind and quality were caught and prepared for storage. Two of the fish were placed in ice storage immediately after being caught, two were placed there after 3 hours, and two each after 6, 9 and 12 hours. Then all the fish were left in storage for 7 days. In fish.fun(1) and fish.fun(2) we do the fit, check the assumptions and draw the fitted lines plot. Now say we want to estimate the quality of the fit for time 5.5 and 20.5. This is done in fish.fun(3). But there is a big difference between those predictions: the one at 5.5 should be very good whereas the one at 20.5 is almost certainly nonsense. The problem is illustrated in fish.fun(4).
Automobile Exhaust
The engine exhaust was analysed in an experiment in which ethanol was burned in a single cylinder automobile test engine. The response variable is NOx, the concentration of nitric oxide (NO) and nitrogen dioxide (NO2) in the engine exhaust, normalized by the work done by the engine. One explanatory variable is the compression ratio C of the engine. This is the ratio of the volume inside the cylinder whn the piston is retracted and when the poiston is all the way inside the cylinder. The other factor is the equivalence ratio E at which the engine was run - a measure of the richness of the air/ethanol mix, as E increases there is more fule in the mixture.
Variables:
NOx: Concentration of nitric oxide (NO) and nitrogen dioxide (NO2)
Compression: Compression ratio
Equivalence: Equivalence ratio
Data source: Brinkman, N. D. (1981). Ethanol Fuel - A single-cylinder engine study of efficiency and exhaust emissions. SAE transactions, 90 (No 810345), 1410-1424.
US Temperatures
The data gives the normal average January minimum temperature in degrees Fahrenheit with the latitude and longitude of 56 U.S. cities. (For each year from 1931 to 1960, the daily minimum temperatures in January were added together and divided by 31. Then, the averages for each year were averaged over the 30 years.)
Variables:
City: City
State: State postal abbreviation
JanTemp: Average January minimum temperature in degrees F.
Latitude: Latitude in degrees north of the equator
Longitude: Longitude in degrees west of the prime meridian
Pain Reliever
A pharmaceutical company set up an experiment in which patients with a common type of headache were treated with a new analgesic or pain reliever. The analgesic was given to each patient in one of four dosage levels: 2,5,7 or 10 grams. Then the time until noticeable relieve was recorded in minutes. In addition the sex and the blood pressure of each patient was recorded. The blood pressure groups where formed by comparing each patients diastolic and systolic pressure reading with historical data. Based on this comparison the patients are assigned to one of three types: low (0.25), medium (0.5), high (0.75) according to the respective quantiles of the historic data.
Toxins in Trout
Casella and Berger (p522) describe an experiment to measure the amount of deterioration on the liver of trouts, depending on three toxins and a control. The data is:
| Toxin 1 |
Toxin 2 |
Toxin 3 |
Control |
| 28 |
33 |
18 |
11 |
| 23 |
33 |
21 |
14 |
| 14 |
34 |
20 |
11 |
| 27 |
29 |
22 |
16 |
|
31 |
24 |
|
|
34 |
|
|
School Absences
Dataset of school children in New South Wales (Australia) by S. Quine. The response variable is the number of days absent from school in a year by children from a large town. The children were classified by four factors as follows:
1) Eth: ethnic group, 2 levels (aboriginal and non-aboriginal)
2) Sex: Sex, 2 levels, male and female
3) Age: Age groups, 4 levels, primary, first form, second form or third form
4) Lrn: Learner class, 2 levels, slow learner or average learner.
Poison
Box, Hunter and Hunter describe an experiment measuring survival times (in units of 10 hours) of animals which were given one of three poisons, labeled I, II or III, and one of each of 4 treatments, labeled A-C.
Challenger shuttle disaster
On Jan 28, 1986, at 11.38 am EST, the space shuttle challenger was launched from Cape Canaveral, Florida.
The mission ended 73 seconds later when the Challenger exploded.
All 7 crew members were killed.
Challenger Disaster Movie
What happened?
Hot propellant gases flew past the aft joint of the right solid rocket booster, burning through two rubber O-rings.
An investigation ensued into the reliability of the shuttle's propulsion system. The explosion was eventually traced to the failure of one of the three field joints on one of the two solid booster rockets. Each of these six field joints includes two O-rings, designated as primary and secondary, which fail when phenomena called erosion and blowby both occur.
The night before the launch a decision had to be made regarding launch safety. The discussion among engineers and managers leading to this decision included concern that the probability of failure of the O-rings depended on the temperature t at launch, which was forecase to be 31 degrees F. There are strong engineering reasons based on the composition of O-rings to support the judgment that failure probability may rise monotonically as temperature drops.
The discussion centered on the following data from the previous 23 shuttle launches:
| Temperature at Launch Time |
O-ring Failures |
| 66 |
0 |
| 70 |
1 |
| 69 |
0 |
| 68 |
0 |
| 67 |
0 |
| 72 |
0 |
| 73 |
0 |
| 70 |
0 |
| 57 |
1 |
| 63 |
1 |
| 70 |
1 |
| 78 |
0 |
| 67 |
0 |
| 53 |
2 |
| 67 |
0 |
| 75 |
0 |
| 70 |
0 |
| 81 |
0 |
| 76 |
0 |
| 79 |
0 |
| 75 |
2 |
| 76 |
0 |
| 58 |
1 |
In the discussion the day before the launch the following graph was used to illustrate the data:
Experiment in Soldering
This experiment was designed and implemented by one of AT & T's factories to investigate alternatives in the "wave-soldering" procedure for mounting electronic components on circuit boards. Five different factors were considered as having an effect on the number of solder "skips". They are
1) Opening: amount of clearance around the mounting pad
2) Solder: amount of solder
3) MAsk: type and thickness of the material used for the solder masks
4) PadType: the geometry and size of the mounting pad
5) Panel: each board was divided into three panels, with three runs on a board
6) Response: skips: the number of solder skips on a circuit board
Rocks
We have measurements on four cross-sections of each of 12 oil-bearing rockes The measurements are the end product of a complex image-analysis and represent the total area, total perimeter and a measure of 'roundness' of the pores in the rock cross-section.
Kyphosis
This dataset is about Kyphosis, a spinal deformity in children that occurs after certain surgeries on the spine. The variables are:
1) Kyphosis: 1 if kyphosis is present, 0 otherwise.
2) Age: age of the child in month.
3) Number: the number of vertebrae involved in the spinal operation.
4) Start: the beginning of the range of the vertebrae involved in the spinal operation.
Detergent brand preference study
In this study the respondents gave their preferences of different laundry detergents. In addition they are classified according to the temerature and the softness of their washing water and whether or not they were previous users of the brand M.
Source: Ries & Smith (1963)
Tobacco Budworm
Collett (1991) reports the results of an experiment on the toxicity of the tobacco budworm Heliothis virescens to doses of the pyrethoid trans-cypermethin to which the moths were beginning to show resistance. Batches of 20 moths of each sex were exposed for 3 days to the pyretoid and the number in each batch which were dead or knocked down was recorded.
Alcohol and Tobacco Expenditures
Average Alcohol and Tobacco Expenditures in the 11 regions of England.
Leukemia
This is (uncensored) survival times for leukemia, with covariates wbc the white blood cell count and and ag, a test result with values "present" or "absent".
Gehan
A data frame from a trial of 42 leukaemia patients. Some were treated with the drug _6-mercaptopurine_ and the rest are controls. The trial was designed as matched pairs, both withdrawn from the trial when either came out of remission.
Lung Cancer
Survival in patients with lung cancer at Mayo Clinic. Performance scores rate how well the patient can perform usual daily activities.
Variables:
inst: Institution code
time: Survival time in days
status: censoring status 1=censored, 2=dead
age: Age in years
sex: Male=1 Female=2
ph.ecog: ECOG performance score (0=good 5=dead)
ph.karno: Karnofsky performance score (bad=0-good=100) rated by physician
pat.karno: Karnofsky performance score rated by patient
meal.cal: Calories consumed at meals
wt.loss: Weight loss in last six months
Source: Terry Therneau
Water Quality and Mining
The effects of mining and rock type on water quality.
Response: Iron (Iron content of water)
Factor: Rock: type of stor (Limestone or Sandstone)
Factor: Mine: Status of mine (Abondoned, Reclaimed, Unmined)
Growth Rates of Lobsters
Data from an experiment to raise Florida lobster in a controlled environment. The data shoe the overall length and the age of a certain species of lobster.
Weather in New York
Daily measurements of ozone concentration, wind speed, temperature and solar radiation in New York City from May to September of 1973.
Variables:
ozone: Average ozone concentration (of hourly measurements) of in parts per billion.
radiation: Solar radiation (from 08:00 to 12:00) in langleys.
temperature: Maximum daily emperature in degrees Fahrenheit.
wind: Average wind speed (at 07:00 and 10:00) in miles per hour.
Source: Bruntz, S. M., W. S. Cleveland, B. Kleiner, and J. L. Warner.
(1974). The Dependence of Ambient Ozone on Solar Radiation, Wind,
Temperature, and Mixing Height. In _Symposium on Atmospheric
Diffusion and Air Pollution_, pages 125-128. American
Meterological Society, Boston.
Exports from Barbados
The Annual Statistical Digest of the Central Bank of Barbados gives data on various exports from the island nation.
Air Pollution and Mortality Rates
We have data for 59 metropolitan areas in the US on the age-adjusted mortality rates. The dataset also includes variables measuring demographic characteristics of the cities, variables measuring climate characteristics, and variables recording the pollution potential of three different air pollutants.
Ozone Levels
Ozone Data from New Jersey, New York, Connecticut, and Massachusetts: Data Quality Assessment and Temporal and Geographical Properties", Bell Laboratories Memorandum, July 17, 1975.
Original data collected by New Jersey Department of Environmental Protection, New York State Department of Environmental Protection, Boyce Thompson Institute (Yonkers, NY data), Connecticut Department of Environmental Protection, and Massachusetts Department of Public Health.
Variables: median of daily maxima ozone concentration for June-August, 1974. Concentrations in parts per billion (ppb). Data is for Yonkers, New York and Stamford, Connecticut, which are about 20 miles apart.
States
Data sets related to the 50 states of the United States of America.
'Population': population estimate as of July 1, 1975
'Income': per capita income (1974)
'Illiteracy': illiteracy (1970, percent of population)
'Life Exp': life expectancy in years (1969-71)
'Murder': murder and non-negligent manslaughter rate per 100,000 population (1976)
'HS Grad': percent high-school graduates (1970)
'Frost': mean number of days with minimum temperature below freezing (1931-1960) in capital or large city
'Area': land area in square miles
Source: U.S. Department of Commerce, Bureau of the Census (1977) _Statistical Abstract of the United States_.
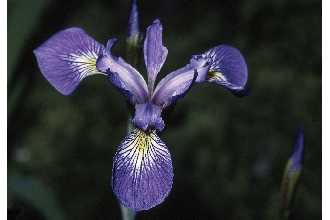
Fisher's Iris
This famous (Fisher's or Anderson's) iris data set gives the measurements in centimeters of the variables sepal length and width and petal length and width, respectively, for 50 flowers from each of 3 species of iris. The species are
Iris setosa:

Iris versicolor:
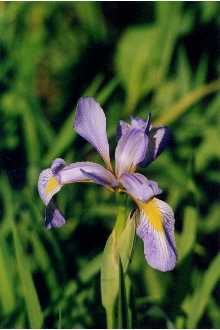
and Iris virginica:
Ratings of Painters
The subjective assessment, on a 0 to 20 integer scale, of 54 classical painters. The painters were assessed on four characteristics: composition, drawing, colour and expression. They were also grouped in 8 "Schools". The data is due to the Eighteenth century art critic, de Piles.
Birth Weights
This dataset has 189 observations and 10 variables. The data were collected at Baystate Medical Center, Springfield, Mass during 1986. The variables are
'low' indicator of birth weight less than 2.5kg
'age' mother's age in years
'lwt' mother's weight in pounds at last menstrual period
'race' mother's race ('1' = white, '2' = black, '3' = other)
'smoke' smoking status during pregnancy
'ptl' number of previous premature labours
'ht' history of hypertension
'ui' presence of uterine irritability
'ftv' number of physician visits during the first trimester
'bwt' birth weight in grams
Source: Hosmer, D.W. and Lemeshow, S. (1989) _Applied Logistic Regression._ New York: Wiley
Spam
The "spam" concept is diverse: advertisements for products/web sites, make money fast schemes, chain letters, pornography... Designing a useful spam filter is a very important but also vey difficult problem. This collection of spam e-mails came from the postmaster and individuals who had filed spam. The collection of non-spam e-mails came from filed work and personal e-mails of the creator George Forman, and hence the word 'george' and the area code '650' are indicators of non-spam. These are useful when constructing a personalized spam filter. One would either have to blind such non-spam indicators or get a very wide collection of non-spam to generate a general purpose spam filter.
Sources: Creators: Mark Hopkins, Erik Reeber, George Forman, Jaap Suermondt, Hewlett-Packard Labs, 1501 Page Mill Rd., Palo Alto, CA 94304
Number of Instances: 4601 (1813 Spam = 39.4%)
Number of Attributes: 58 (57 continuous, 1 nominal class label)
Attribute Information:
The last column of spam denotes whether the e-mail was considered spam (1) or not (0), i.e. unsolicited commercial e-mail. Most of the attributes indicate whether a particular word or character was frequently occuring in the e-mail. The run-length attributes (55-57) measure the length of sequences of consecutive
capital letters. For the statistical measures of each attribute, see the end of this file. Here are the definitions of the attributes:
48 continuous real [0,100] attributes of type word_freq_WORD = percentage of words in the e-mail that match WORD, i.e. 100 * (number of times the WORD appears in the e-mail) / total number of words in e-mail. A "word" in this case is any string of alphanumeric characters bounded by non-alphanumeric characters or end-of-string.
6 continuous real [0,100] attributes of type char_freq_CHAR = percentage of characters in the e-mail that match CHAR, i.e. 100 * (number of CHAR occurences) / total characters in e-mail
1 continuous real [1,...] attribute of type capital_run_length_average = average length of uninterrupted sequences of capital letters
1 continuous integer [1,...] attribute of type capital_run_length_longest = length of longest uninterrupted sequence of capital letters
1 continuous integer [1,...] attribute of type capital_run_length_total = sum of length of uninterrupted sequences of capital letters = total number of capital letters in the e-mail
1 nominal {0,1} class attribute of type spam = denotes whether the e-mail was considered spam (1) or not (0), i.e. unsolicited commercial e-mail.
Olympics Men's Long Jump
The data has the gold medal winning performance (in inches) in the men's long jump for the modern Olympic games.
Life Expectancy
For each of the 38 largest countries in the world (according to 1990 population ures), data are given for the country's life expectancy at birth, number of People per TV, and number of People per Doctor.
SOURCE: _The World Almanac and Book of Facts 1993_ (1993), New York: Pharos Books