X̅Control=56.2
Example (From the book An Introduction to the Bootstrap by Efron and Tibshirani) Below we have the results of a small experiment, in which 7 out of 16 mice were randomly selected to receive a new medical treatment, while the remaining 9 mice were assigned to the control group. The treatment was intended to prolong survival after surgery:
| Treatment | 94 | 197 | 16 | 38 | 99 | 141 | 23 | ||
|---|---|---|---|---|---|---|---|---|---|
| Control | 52 | 104 | 146 | 10 | 50 | 31 | 40 | 27 | 46 |
The obvious question is: does the new treatment increase survival times?
How can we answer this question? The first thing we can try is to calculate the mean survival times:
![]() Treatment=86.9
Treatment=86.9
X̅Control=56.2
so the mice in the treatment group lived about 30.7 days longer than those in the control group.
But why the mean? Why not the median or some other measure of "average" Is there some theoretical justification for the mean as the best way to calculate an average? Is it always best?
Very good, but we really don't care about these 16 mice, they are dead anyway. These 16 mice were just a random sample of the population of all mice who might receive this treatment or this control, and what we really want to know is whether the treatment statistically significantly increases survival.
Some standard terminology:
Population: all of the entities (people, events, things etc.) that are the focus of a study
Census: If all the entities of a population are included in the study.
Sample: any subset of the population
Random sample: a sample found through some randomization (flip of a coin, random numbers on computer etc.)
Simple Random Sample (SRS): each "entity" in the population has an equal chance of being chosen for the sample.
Stratified Sample: First divide population into subgroups, then do a SRS in each subgroup.
Bias: a systematic difference between a sample and its population
Statistically Significant: not due to random chance.
Parameter: any numerical quantity associated with a population
Statistic: any numerical quantity associated with a sample
Here is our question again: from the data we know that the difference of the sample means (a Statistic) is 30.7 days. What we really want to know is whether the corresponding difference of the population means (a Parameter) is positive. In other words we want to use the information in the sample to make an inference for the corresponding population.
So, how do we find out whether or not the difference of 30.7 days above is statistically significant? Consider the following boxplot:
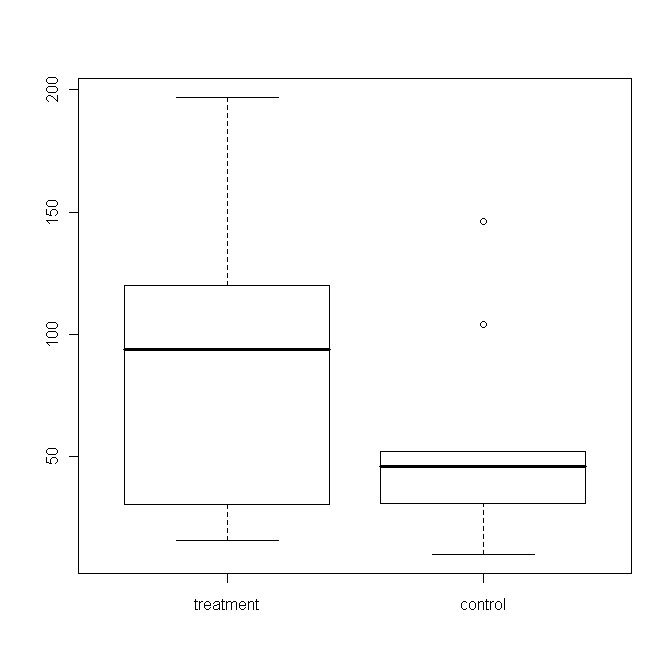
A boxplot shows the 5-number summary:
| Minimum | First Quartile | Median | Third Quartile | Maximum |
together with some rules about possible outliers, drawn as circles here.
In addition to the average of a dataset this also gives us an idea of the variation in the data. This is important for our question because if the variation within the groups is large it will be hard to detect a difference between the groups. Consider the following examples: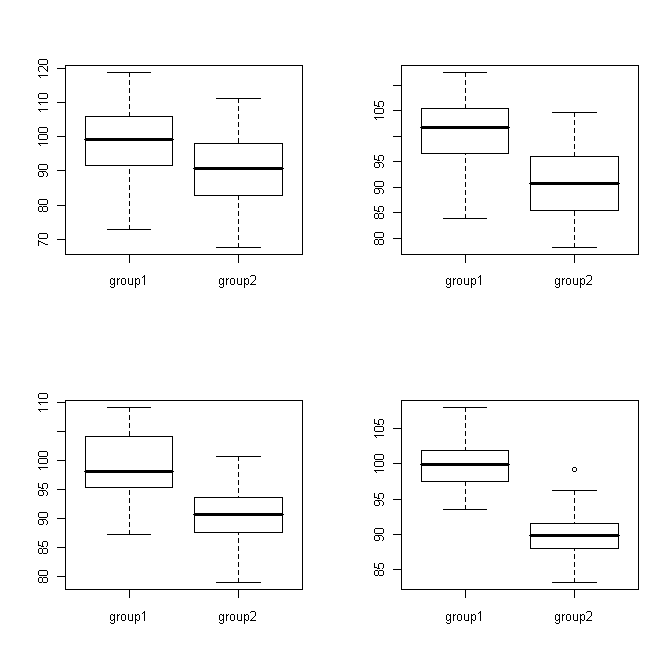
In each of these 4 cases the difference between the means is the same (about 10), but as the variances get smaller this difference becomes more obvious.
So, how can we find the variance of the difference of the mean survival times? First we can find the sample standard deviation:
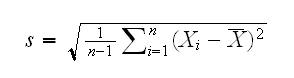
The idea behind this formula is simple:
• Xi-X̅ is the deviation (distance) of each individuel obervation from the mean (these are sometimes called the residuals or errors)
• squaring the residuals gets rid of minus signs (but so would taking absolute values)
• s would be the square root of the mean of these squared deviations, except we would need to devide by n instead of n-1
Finding s within each group we get:
sTreatment= 66.77 and sControl= 42.42
But why the sample standard deviation? Why not some other measure of "variation"?
This is the standard deviation of the individual observations. From here we can find the standard errors of the sample means with s/√n (why?)
standard errorTreatment= 66.77/√7 = 25.2
standard errorcontrol= 42.42/√9 = 14.14
Finally we can find the standard error of the difference of the means:
standard error of difference = √(25.22+14.142)=28.9
Why this formula? This is essentially taking the average of the group standard deviations, so why not use (25.2+14.14)/2=19.67?
So we know we have a sample mean difference of 30.7 with a standard error of 28.9, that is the sample mean difference is 30.7/28.9 =1.05 standard deviations above 0. From probability theory we know that anything within 2 standard deviations might well be due to random fluctuation.
But why 2 standard deviations? Why not 1 or 3 or 4.55?
It seems we can't say that there is a statistically significant difference between the treatment and the control. Does that mean there is no difference? Actually, no: if we had more data and the difference in means of 30.7 days with standard deviations of about 50 would persist, what sample size would be needed to find a statistically significant difference? The graph shows the standard deviations vs. the sample size (equal for both groups):
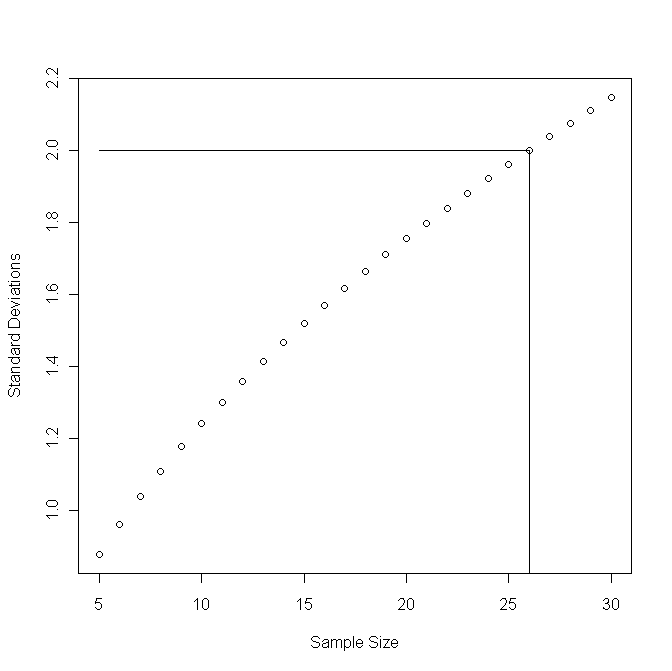
so we would need about 26 mice in each group.
Does this mean the treatment is really better than the control, we just didn't use enough mice in our study? Again, not necessarily, maybe the difference in means of 30.7 would decrease if we used more mice, and we would never pass the threshhold of 2 standard deviations. We can't know that until we run a larger experiment. The above graph just gives us an idea how large such a new experiment should be.